Navigate within Key Business Ratios using the three main tabs (Home, Reports, Ratios) and the subcategories beneath each found on the left. Reports>Industry (shown below) allows users to specify industry by SIC or NAICS code and view Industry Ratios, Variance data and Norms. For help on these modules and their subcategories scroll down or use the quick links above to jump to a topic.
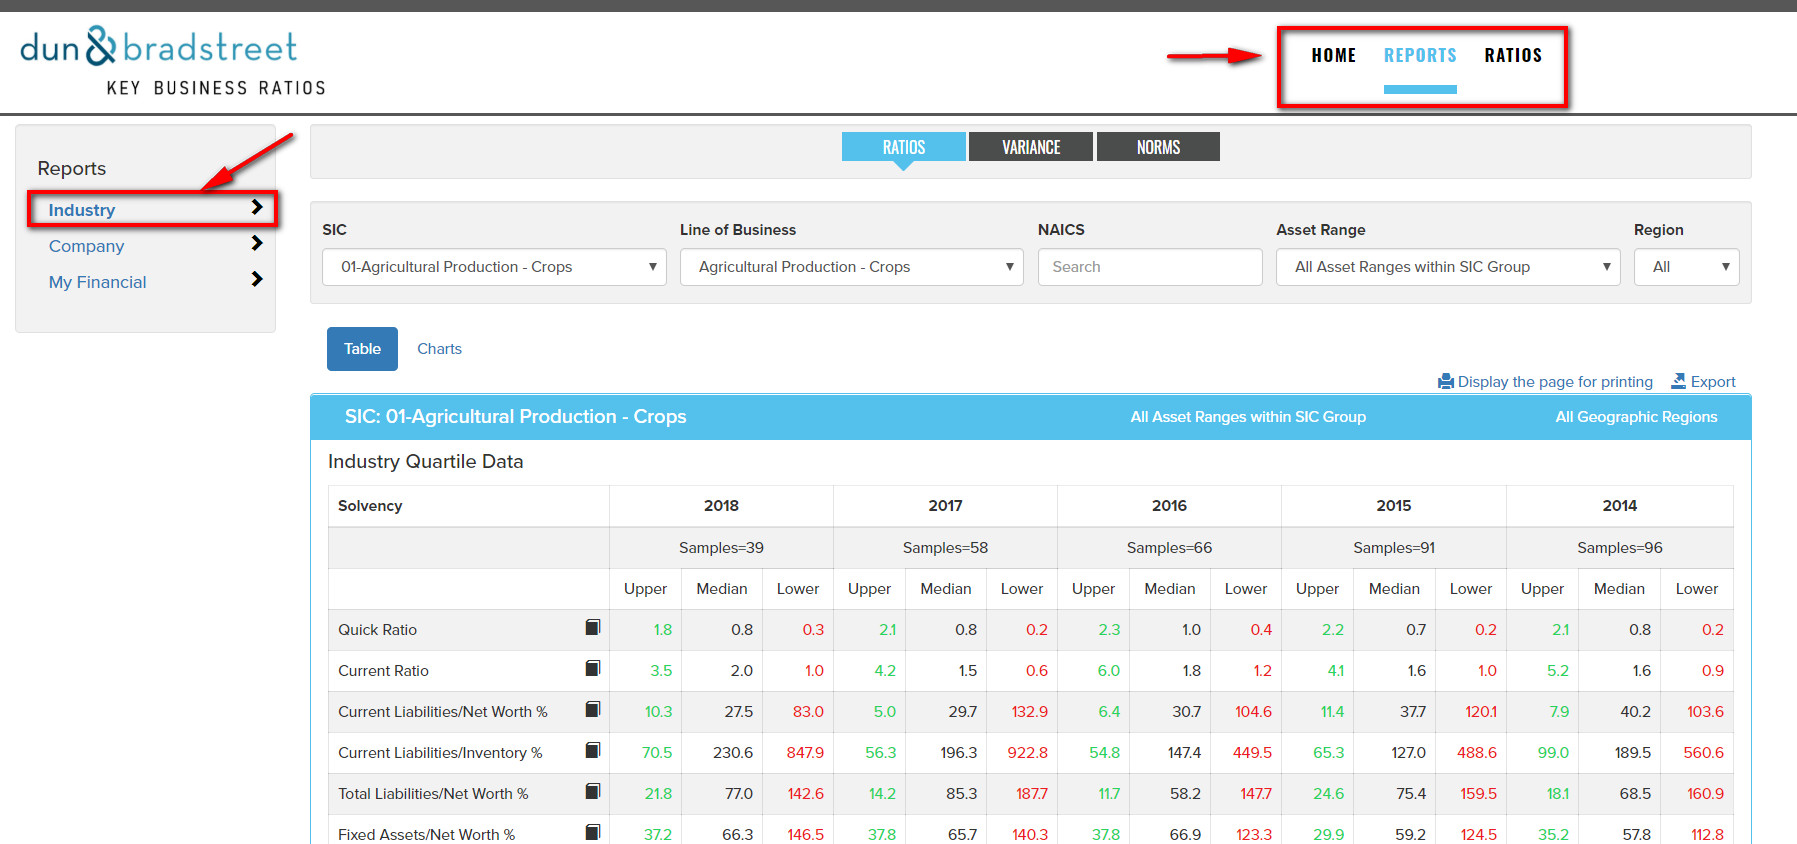
Reports
Industry
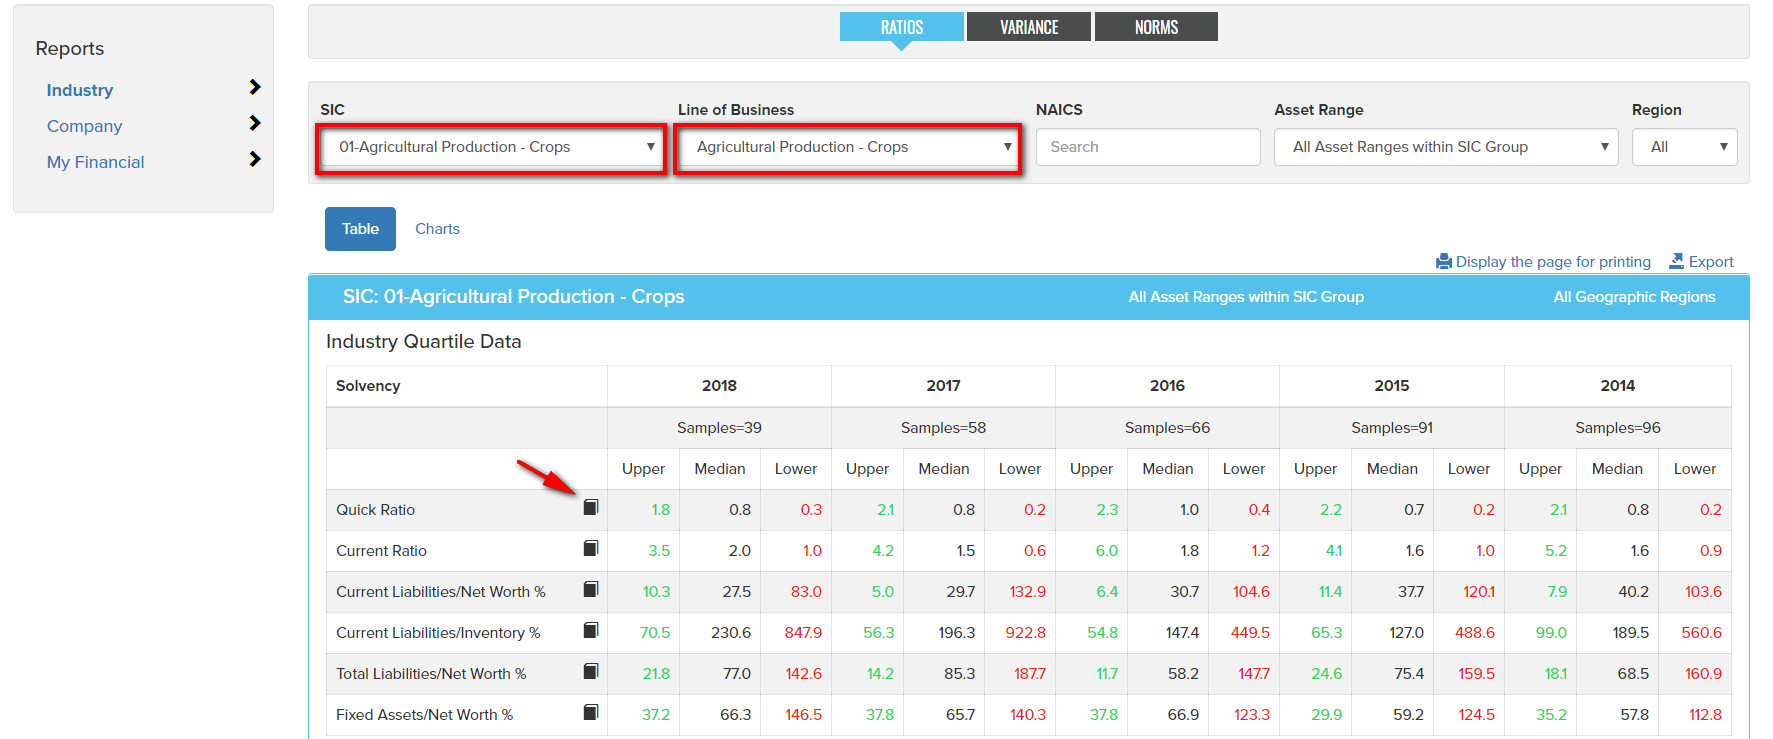
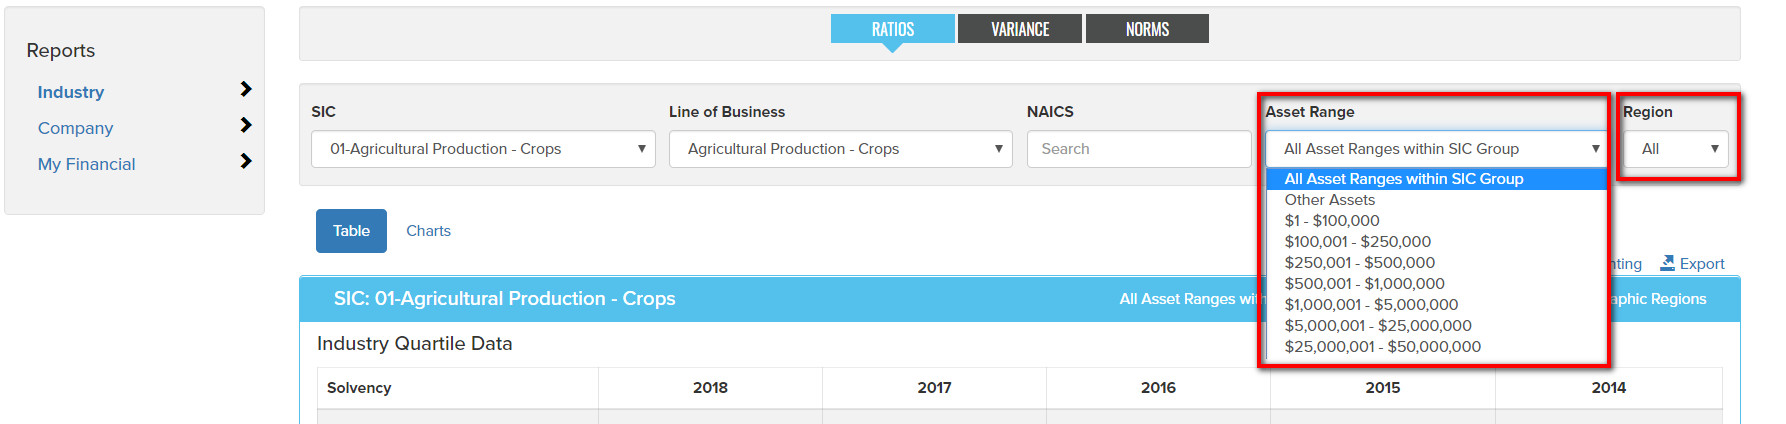
Use the SIC dropdown to select an industry, the Line of Business field can be used to select through an alphabetic listing. The Ratios table below represents industry averages for the chosen industry. Hover over the 'book' icon (arrow) for a description/formula for the ratio.
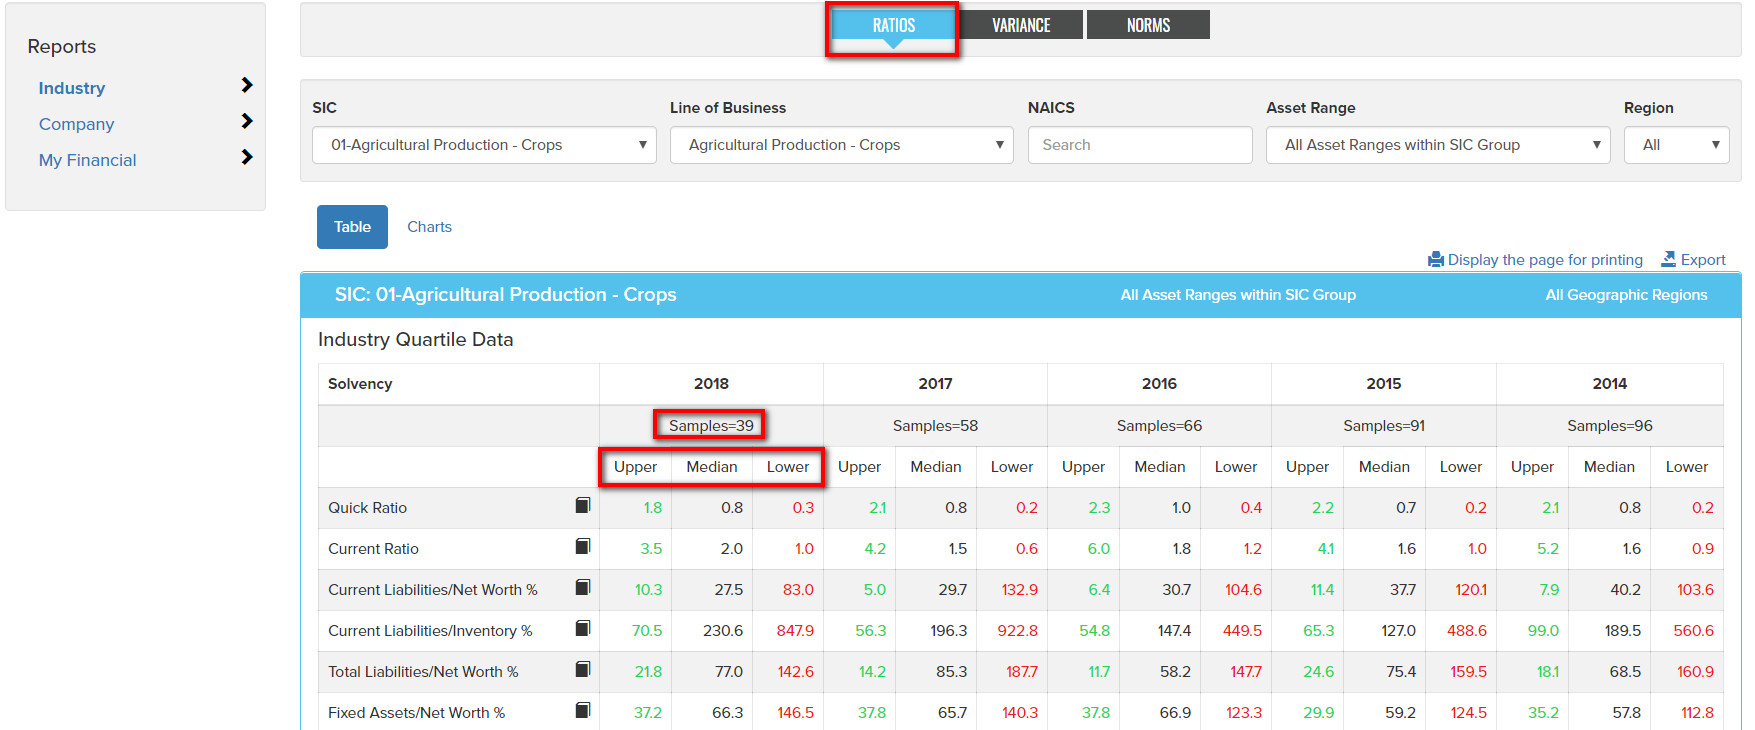
The Industry Ratios report is organized by Industry Quartiles and year. The Ratio Upper and Lower quartile values are shown along with the Median for each year. Five years of ratios are displayed where available. The Samples number represents the number of companies included in the data values.
Industry data can also be presented by Asset Range or Geographic Region where available.
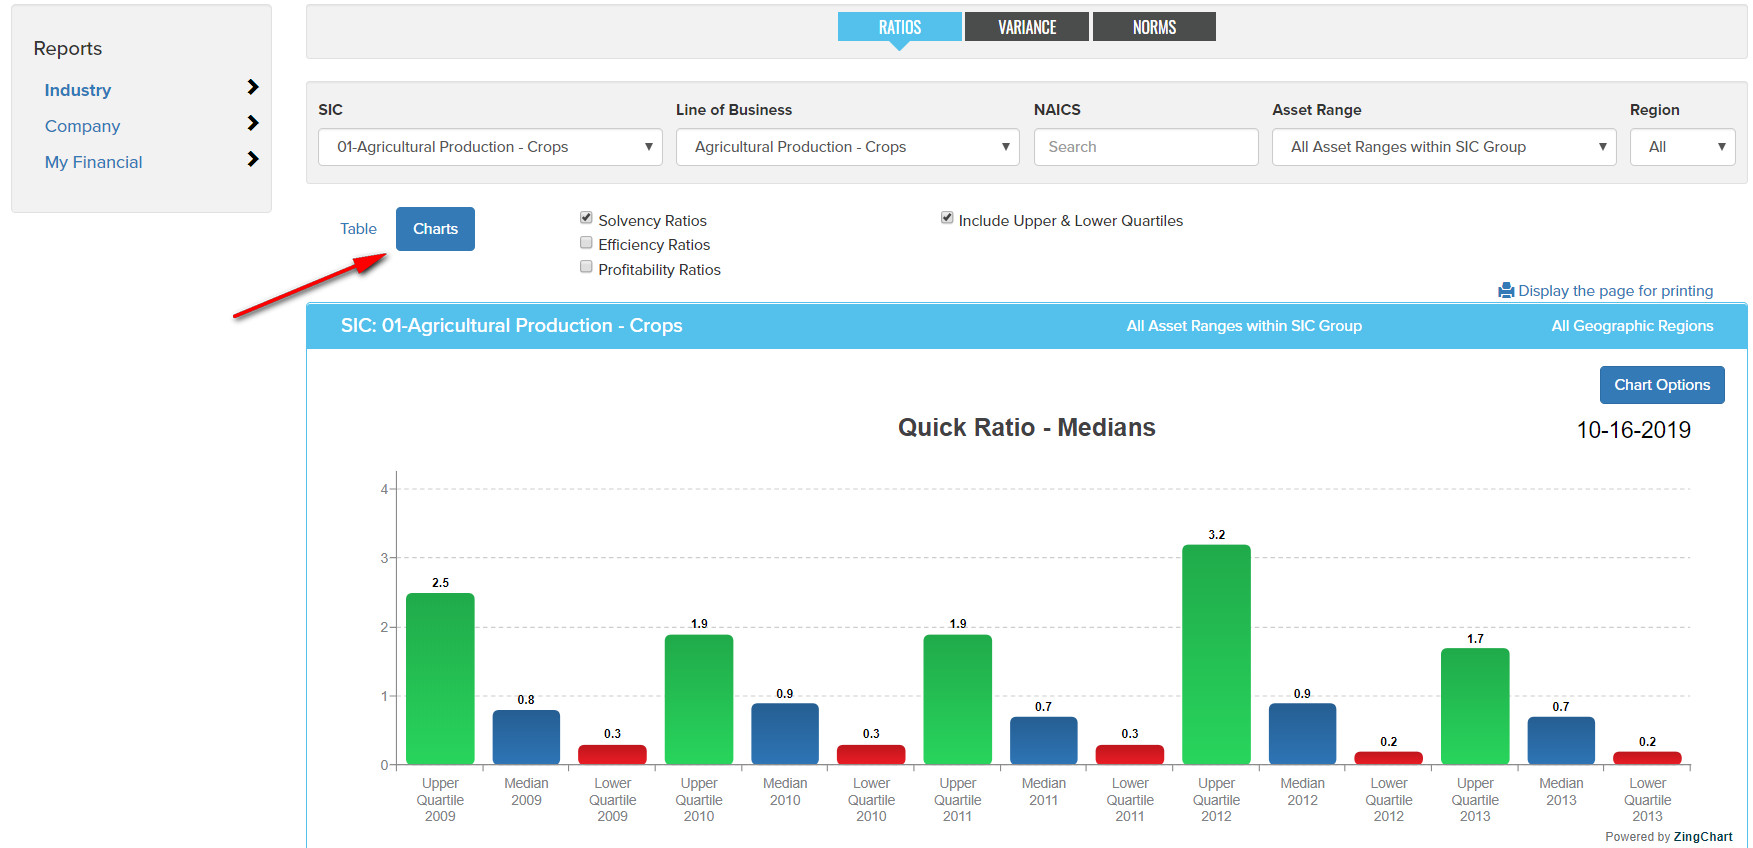
Industry Quartile and Norms data can also be presented in
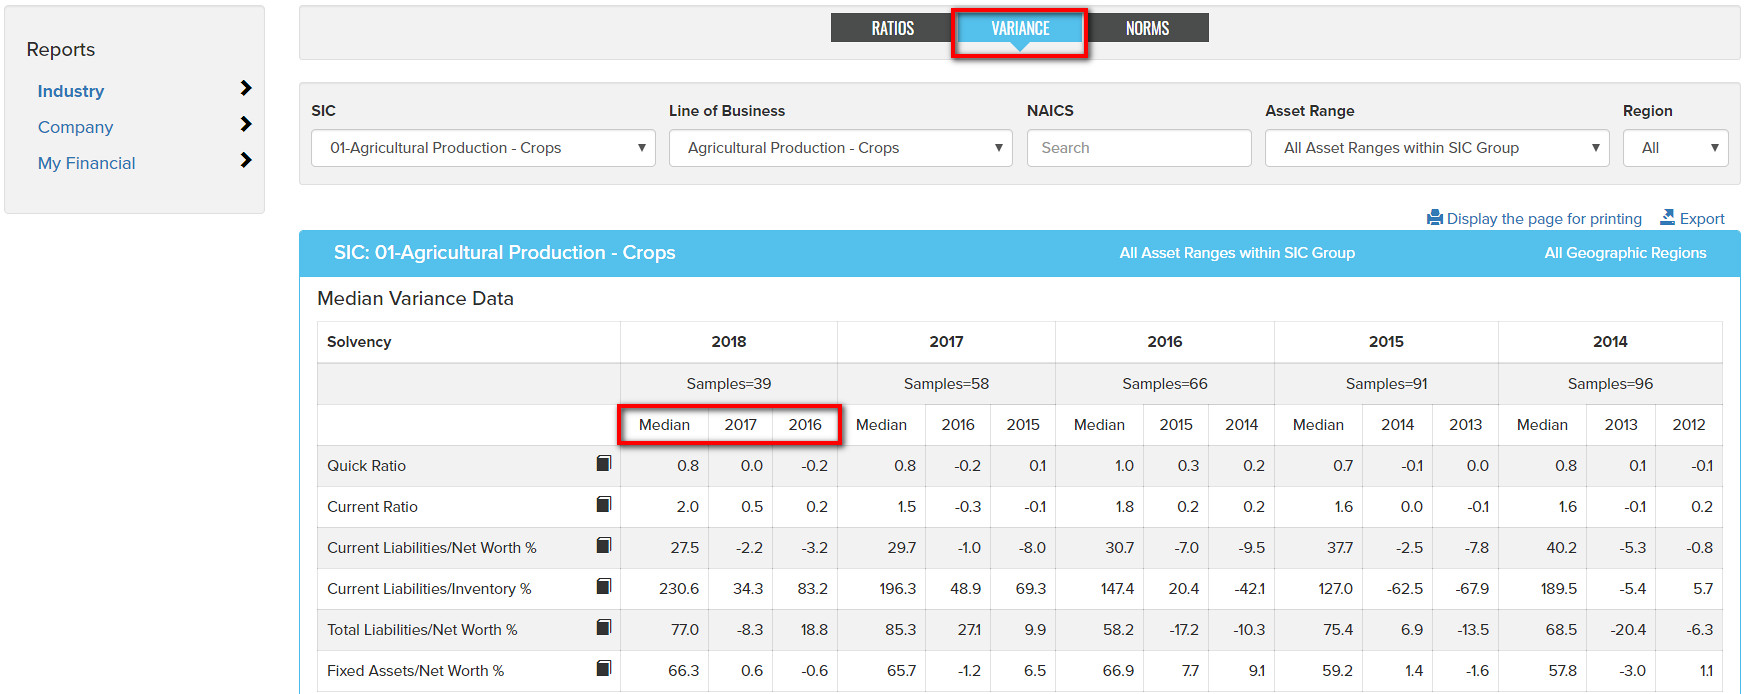
Variance data compares the variance of the industry median value vs. prior two year medians for the past five years where available.
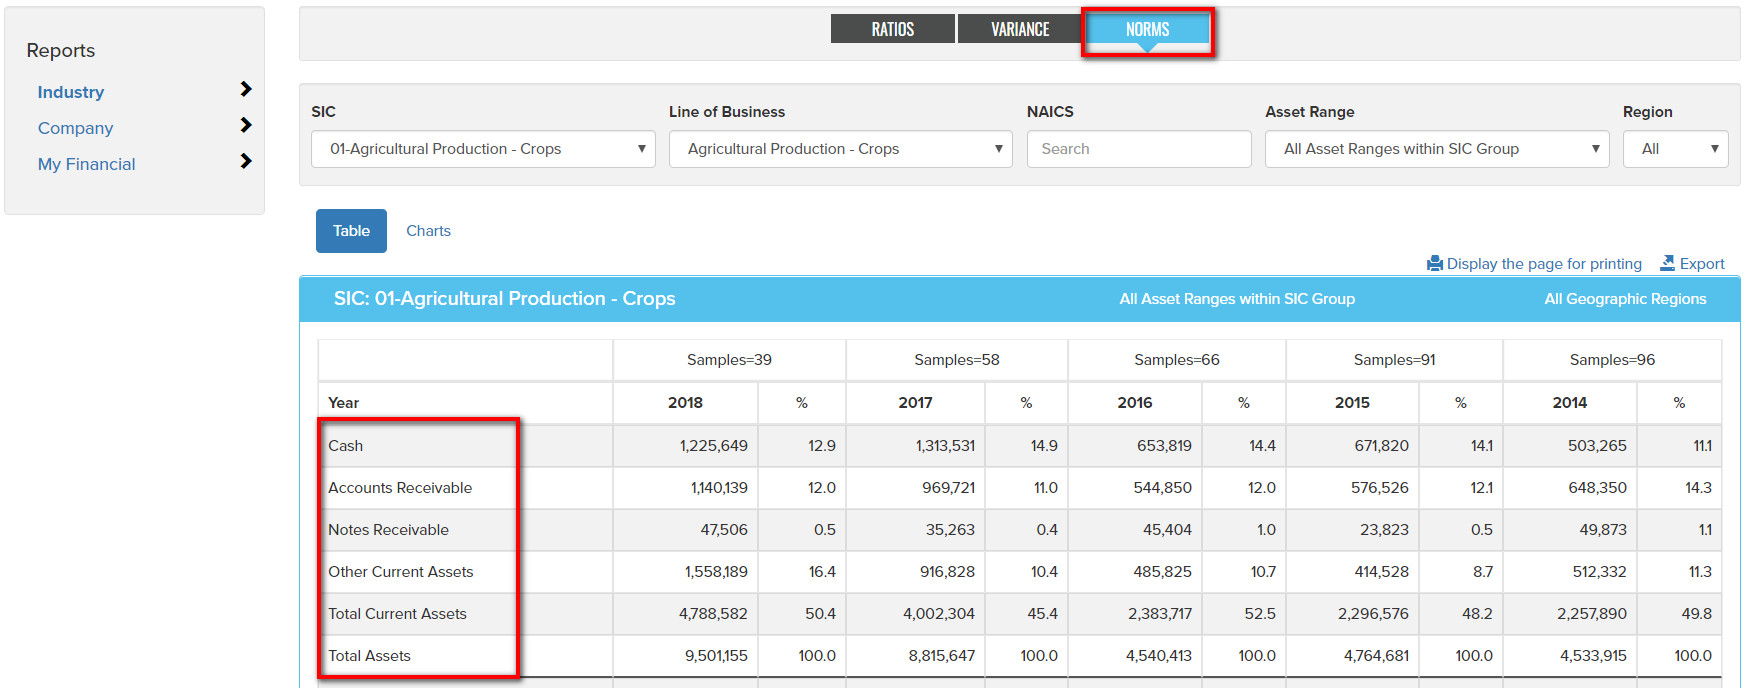
Up to five years of Industry Norms financial data can also be accessed in table and chart form.
Company
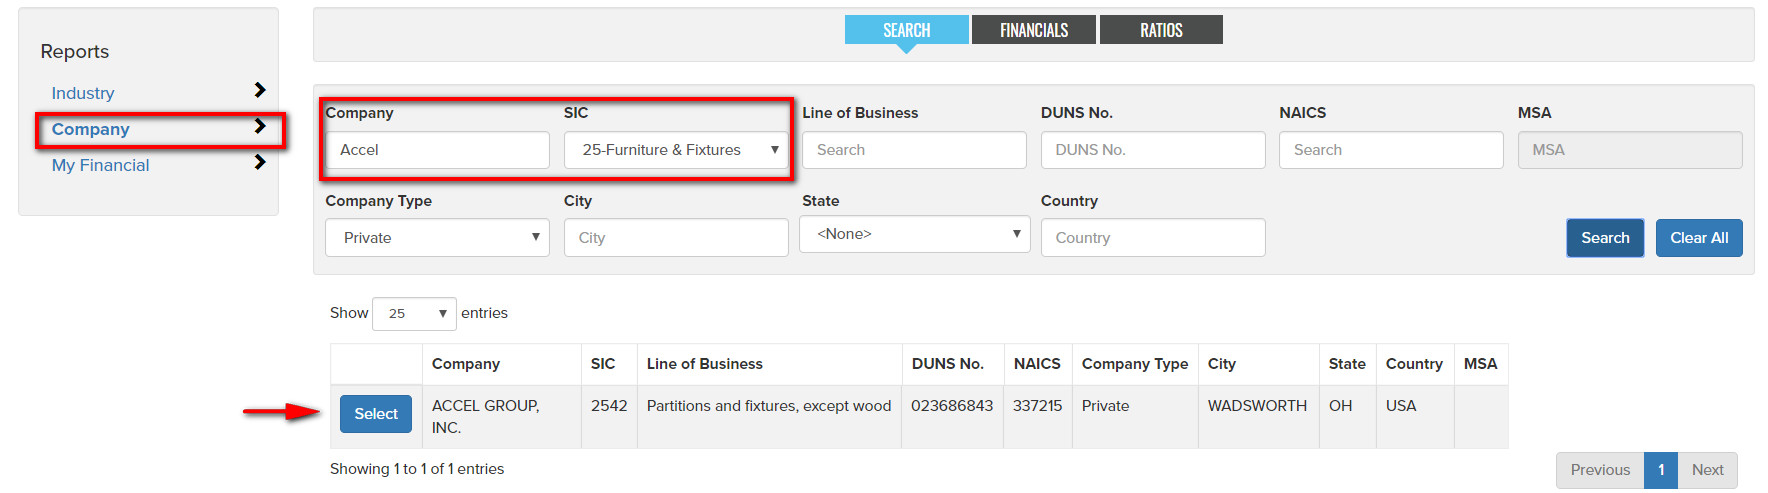
On the Reports tab, the second option after Industry is Company. Use this area to find a specific company. Use known data about the company such as Company Name to fill in one or more of the search fields, then select Search. Use the Select button to view resulting company details.
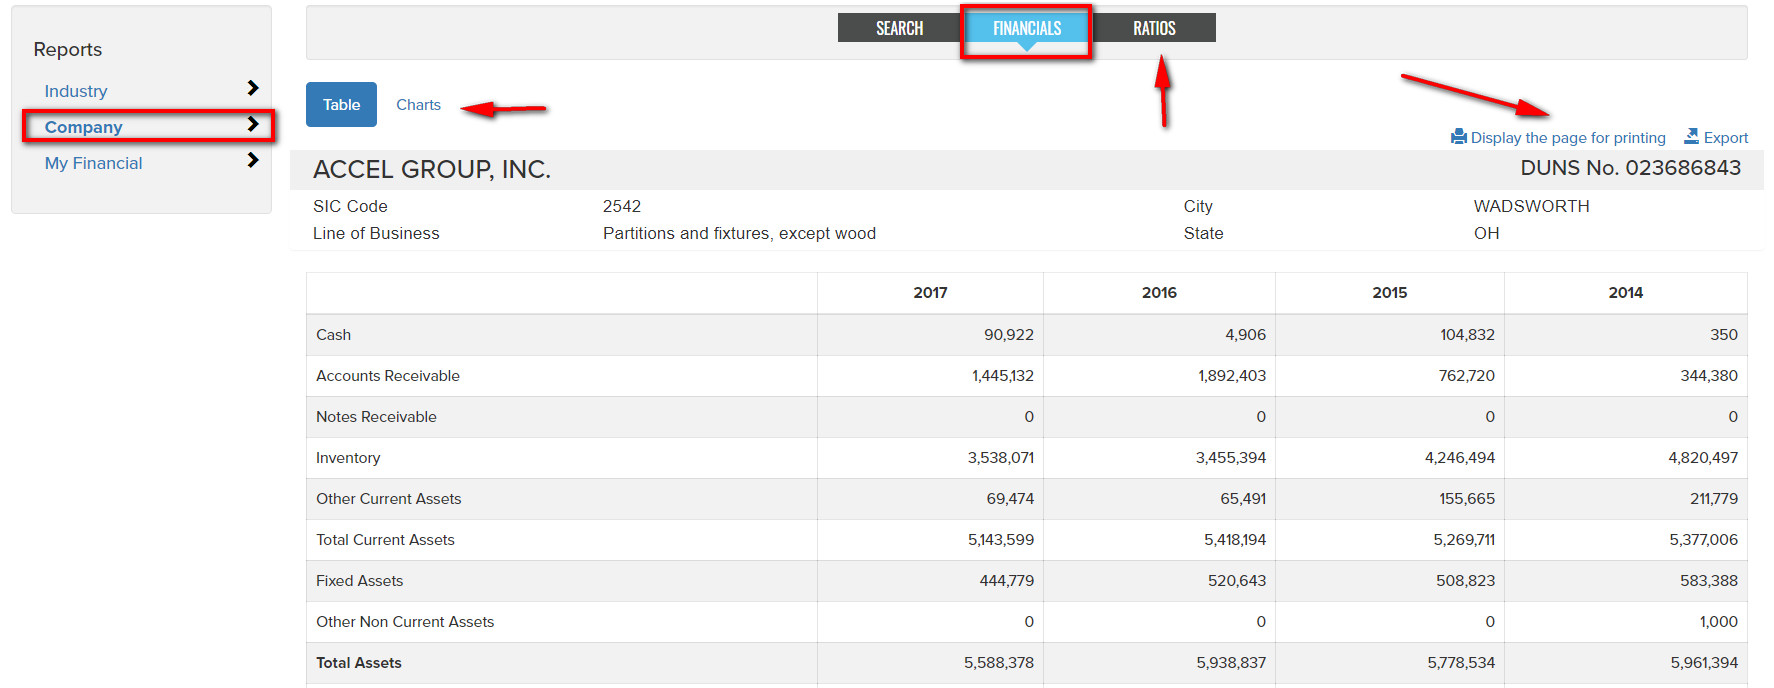
Following a Search, the Select button invokes a financials report for a company, with an additional option for Ratios data. Any report can be formatted for printing or exported (CSV) using the buttons at the top right of reports. Company financial and ratio data can also be charted using the Charts button. Use the Search tab to return to company search results.
My Financial
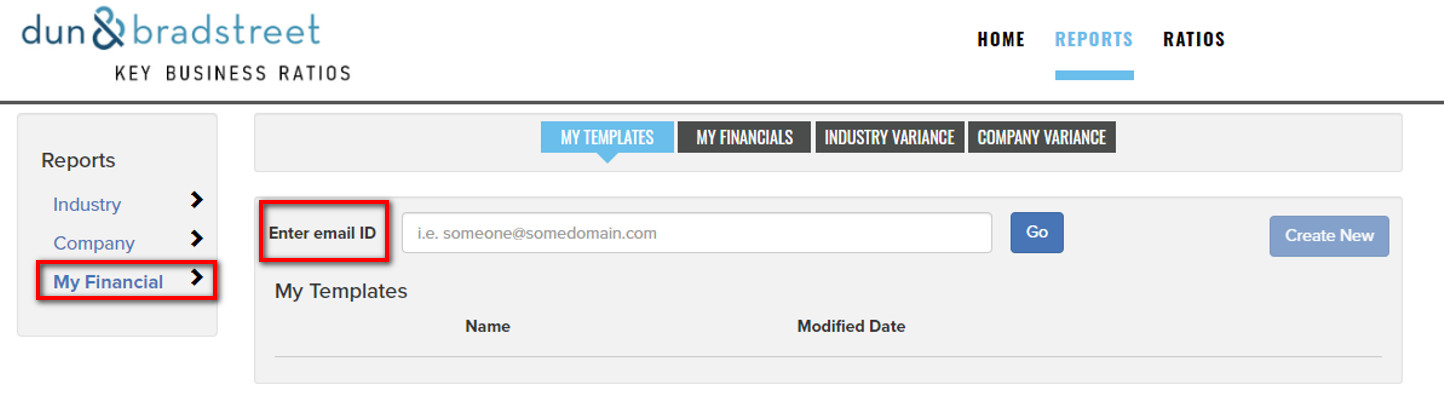
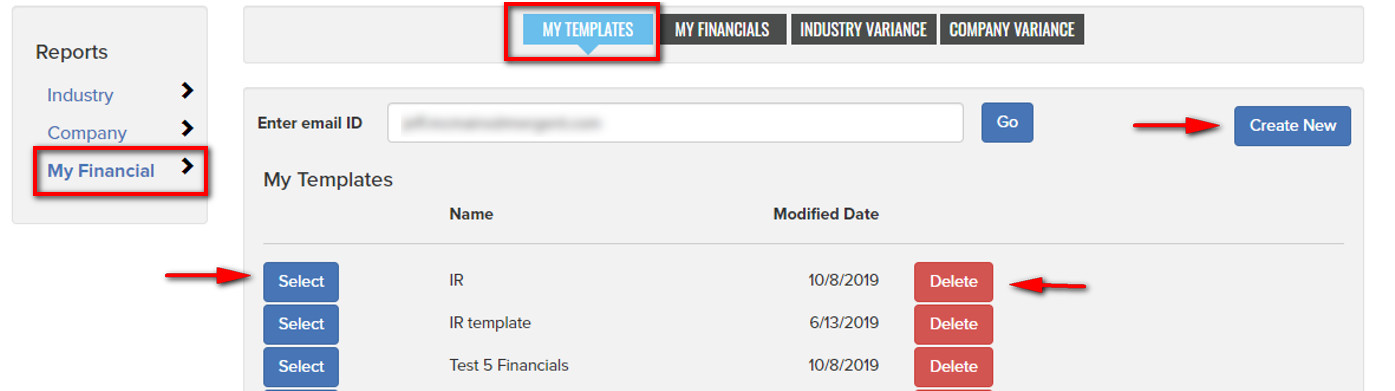
Under Reports tab, My Financial, users can fill in their own summary financial data and then use that information to do comparative ratio analysis to the industry. To begin, use the Create New button to create a new template.
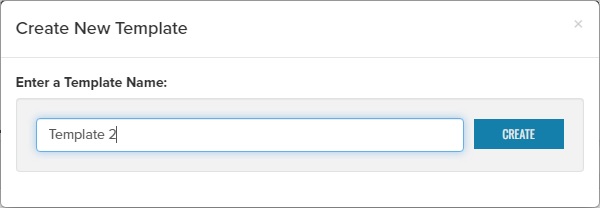
When creating a new template, provide a name and then click the Create button.
To open an existing template use the Select button. Note, templates are saved for the current Key Business Ratios session only.
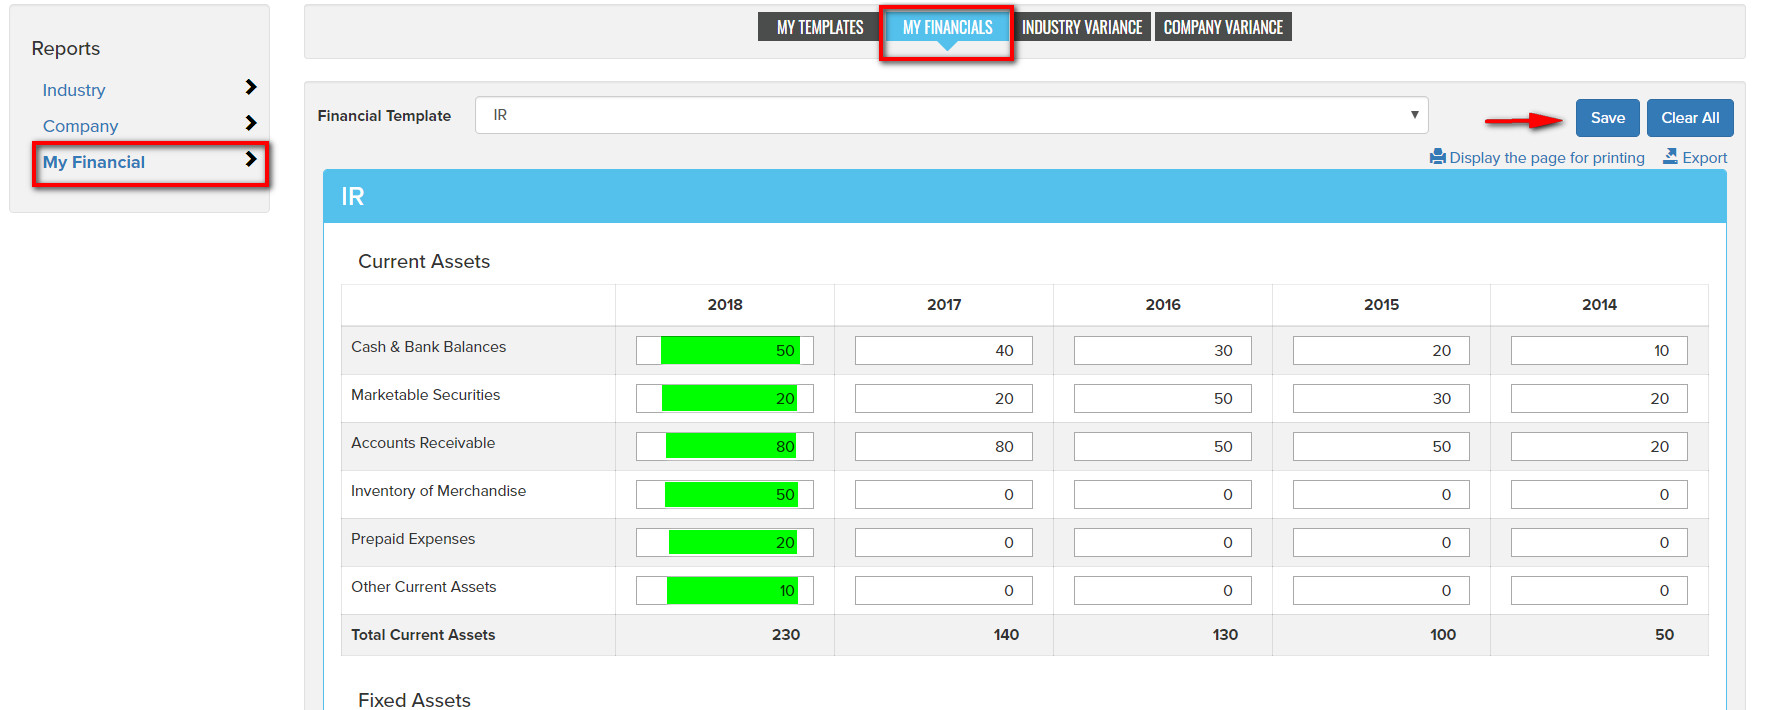
After selecting an existing template or creating a new template, template data can be entered and saved from the My Financials tab which provides a grid for data entry of summary financials (highlighted cells below). Use the Save button to save added or edited data.
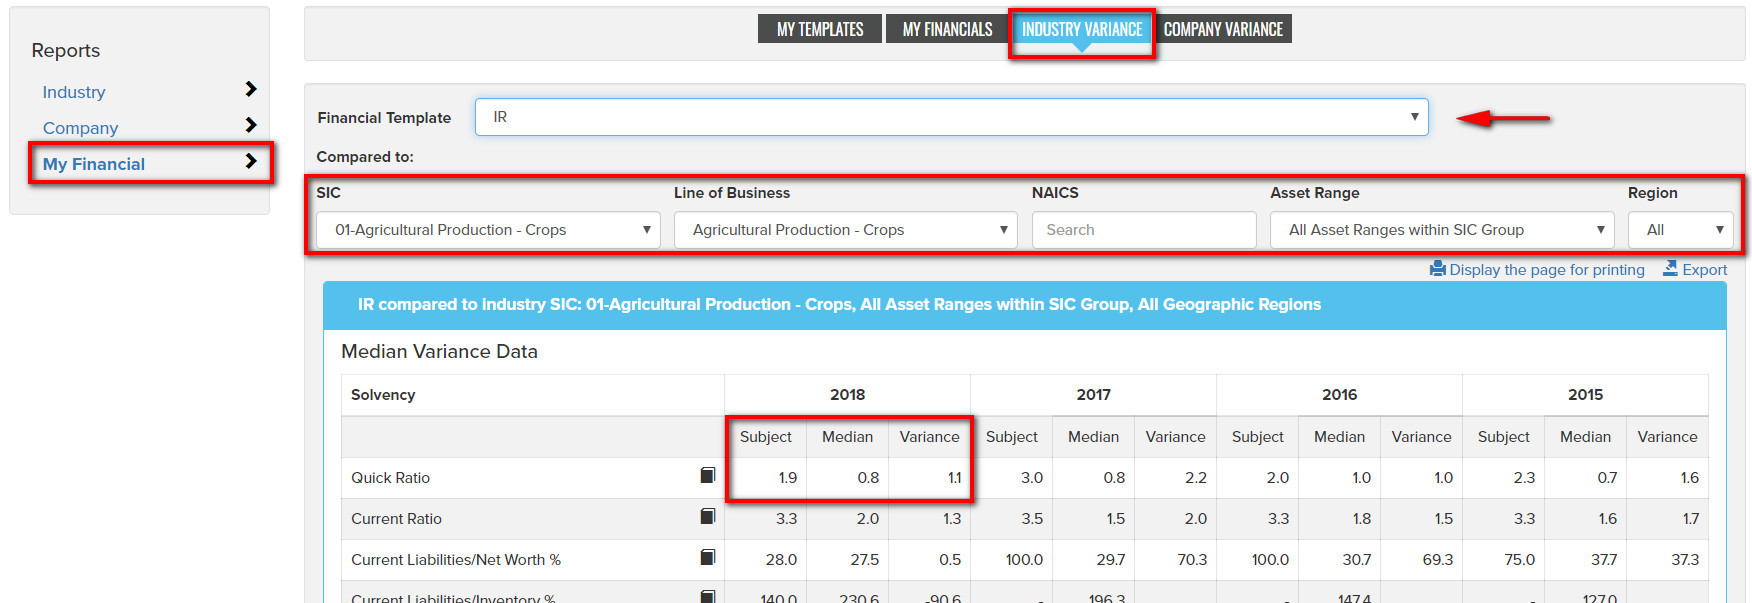
Once financial template data has been entered and saved resulting ratios can be compared to a selected Industry on the Industry Variance tab where the template "Subject" is compared to the Industry median value for each ratio. A Company Variance tab is also provided. The active template can be changed using the Financial Template dropdown list.
Ratios
Industry
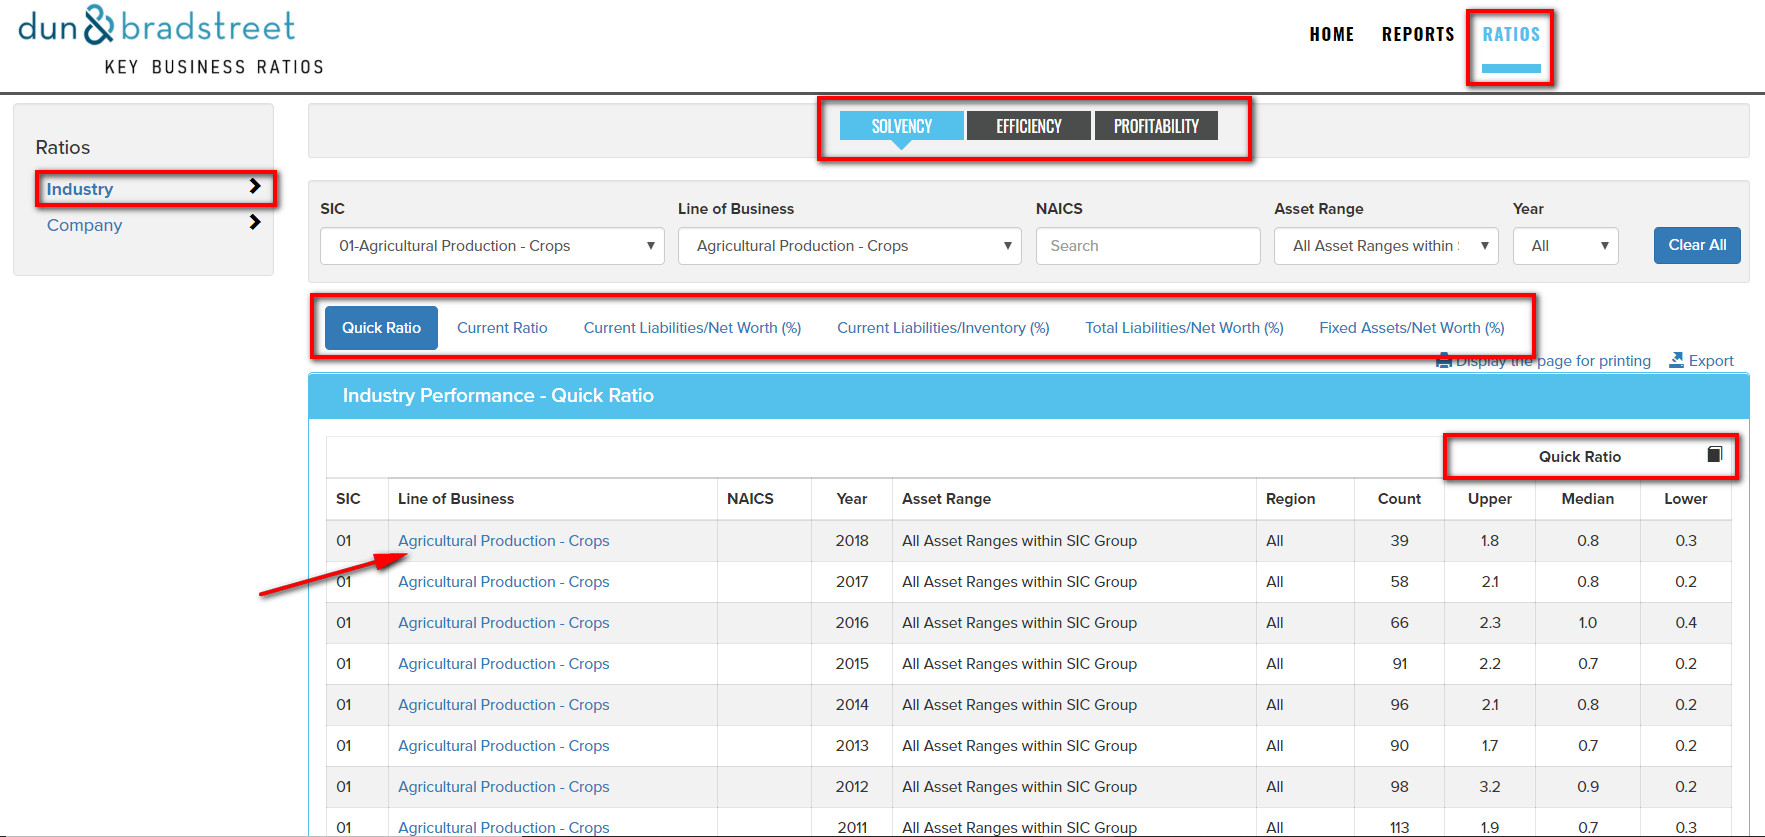
Ratios tab, Industry view provides a customizable report of various ratio types by industry. Fields which can be specified include Industry (by SIC or NAICS code), Line of Business, Asset Range and Year. As selections to these variables are made the report results will automatically refresh. The top level tabs allow you to select the group of ratios to display (Solvency, Efficiency or Profitability), then individual ratios from the group can be chosen using the resulting buttons. Clicking a Line of Business in the report will open the industry specific financials.
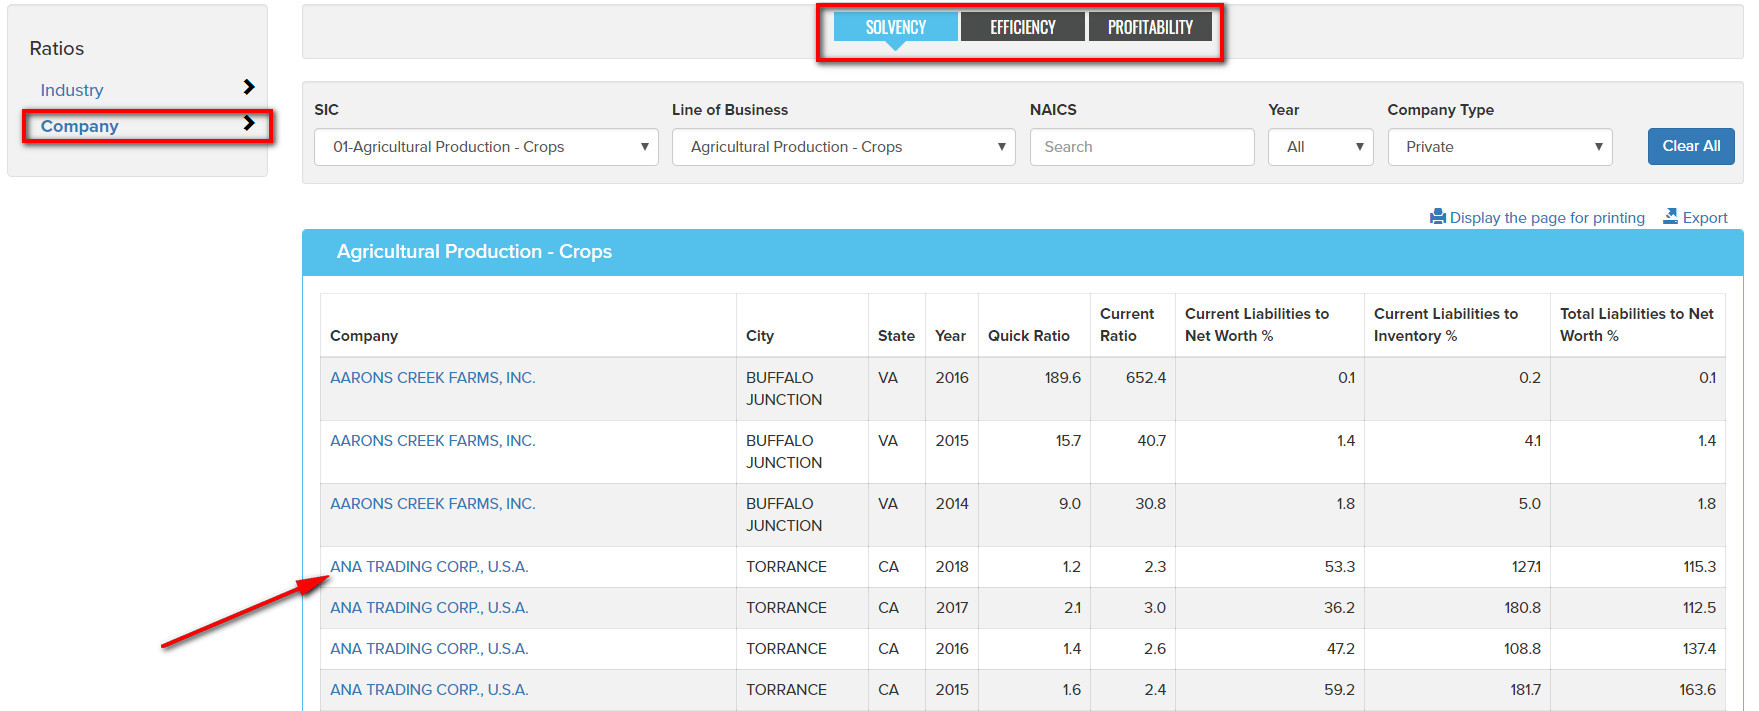
Company
In the Ratios tab, Company display, you can use the SIC, NAICS, and Line of Business and Year selections to define a report. As selections to these variables are made the report results will automatically refresh. The top level tabs allow you to select the group of ratios to display (Solvency, Efficiency or Profitability). Clicking a Company name in the report will open that company's financials.